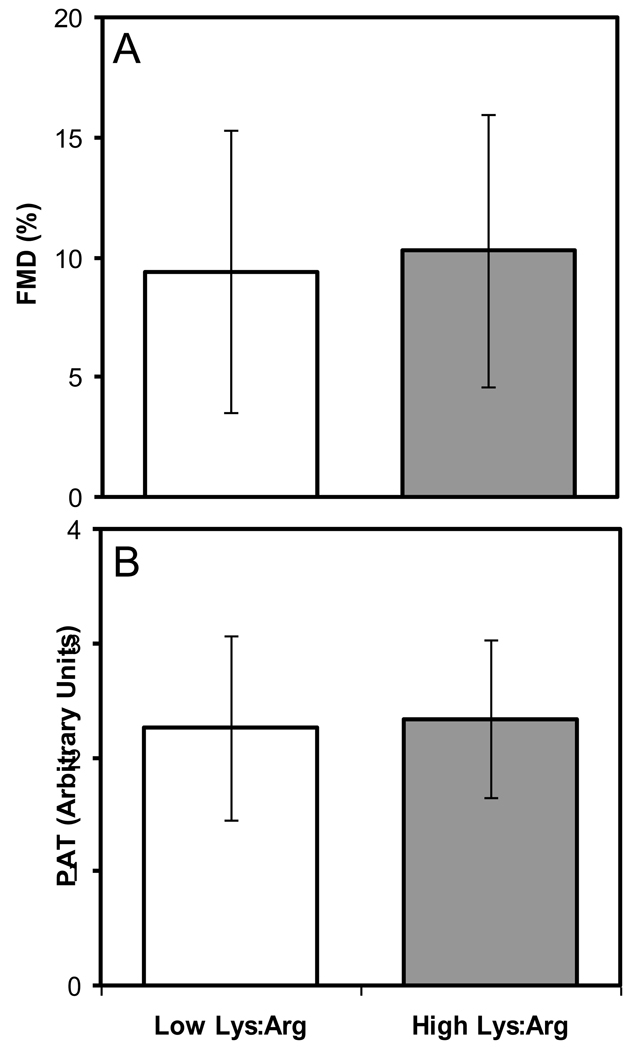
Figure 2.
Vascular reactivity at the end of the two experimental phases was assessed by measuring flow mediated dilation (FMD; %; panel A) and peripheral artery tonometry (PAT; Arbitrary Units; panel B). Results at the end of the low and high Lys:Arg ratio experimental diet phases are shown in clear and dark bars, respectively. A paired t-test was carried out for each variable. Flow mediated dilation data were transformed to rank data before statistical analysis.

