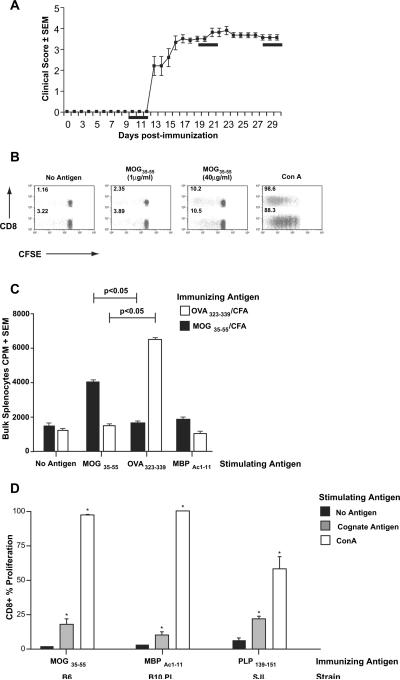
Fig. 1.
Neuroantigen-specific CD8+ T cell responses in EAE. (A) EAE was induced in wildtype female B6 mice with MOG35–55/CFA immunization. A representative disease course is depicted showing mean clinical score ± SEM. The black bars represent the time frames for evaluation of antigen-specific CD4+ and CD8+ T cell responses in various experiments. (B) Bulk splenocytes from MOG-immunized mice (day 20 post-immunization) were labeled with CFSE and cultured for 5 days with the indicated stimuli. Cells were washed, stained and analyzed by flow cytometry. Gated T cells are shown as CD8 vs. CFSE. The CD8(−) population represents specifically gated CD4+ cells. The numbers express the percentage of proliferating cells (% proliferation) within the specific subpopulation (i.e. CFSE dilute CD8+ cells (green)/total CD8+ cells (green and gray)). These data are representative of over 10 independent experiments. (C) The bars show CPM ± SEM from 3H-thymidine-based proliferation assays on bulk splenocytes from either OVA323–339/CFA (white bars) or MOG35–55/CFA-immunized mice (black bars). The in vitro stimulating antigens are shown on the X-axis. (D) Female B6 mice were immunized with MOG35–55, B10.PL with MBPAc1–11 and SJL with PLP139–151. Day 25 post-immunization, CFSE-based proliferation assays were performed on splenocytes, using media alone (no antigen), appropriate stimulating antigen (cognate antigen) or Con A. The bars show CD8+ proliferative responses. Proliferation responses to cognate antigens and Con A were significantly greater than background (*p < 0.01). These results are representative of two to three independent experiments in each strain.

