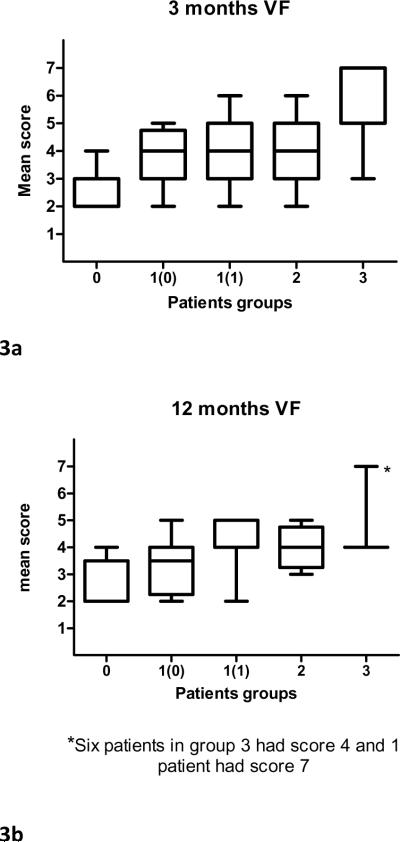
Figure 3.
Videofluoroscopy (VF) summary scores in patient groups 1-3 (classified according to most severe dysphagia grade recorded ≥ 3 months post-CRT). Group 1 was subdivided into 2 groups according to 12 months post-CRT CTCAE score [1(0) and 1(1) for CTCAE scores 0 and 1, respectively]. Horizontal lines=median; Bars=range.

