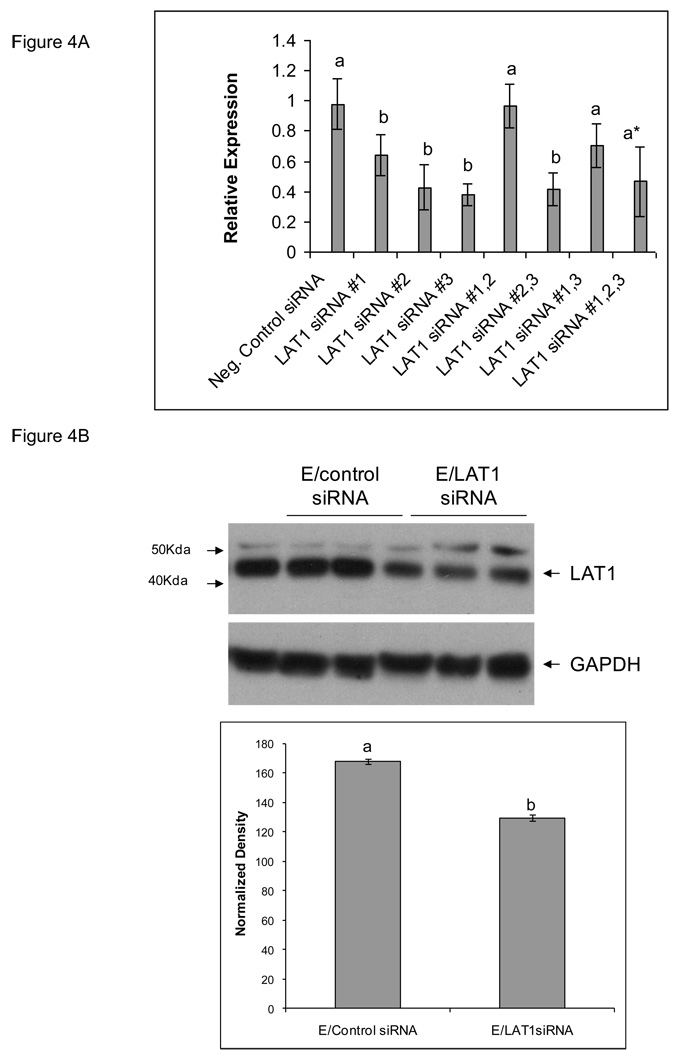
Figure 4. LAT1 gene expression in TS cells transfected with LAT1 siRNA.
A) The effect of LAT1 siRNAs on LAT1 A) mRNA expression was measured by real time PCR, and B) protein expression was measured by Western blot. TS cells transfected with scrambled siRNA vs. LAT1 siRNA are shown. All experiments were carried out three independent times with similar results. Values are the means ± SEM of three measurements. Bars with different letters represent significant differences in LAT1 gene expression among the experimental conditions (p≤0.05).

