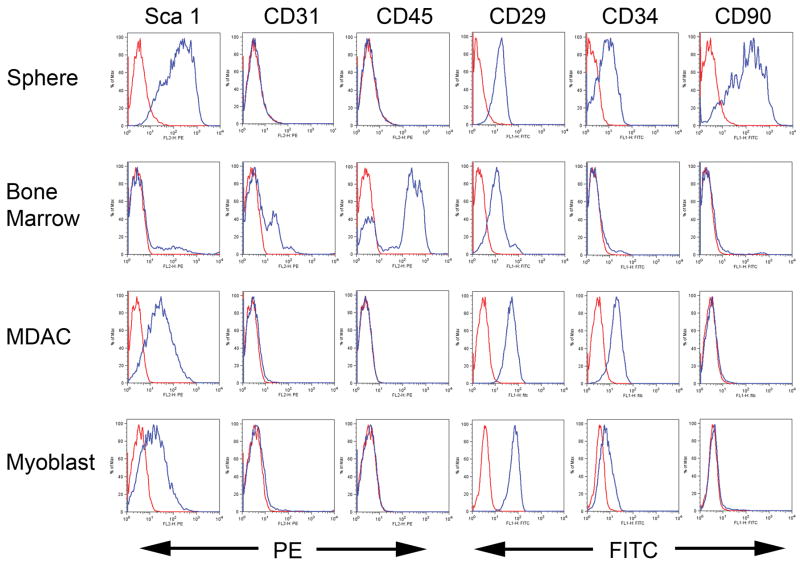
Figure 2. Comparison of FACS profiles.
The expression of various cell surface markers were determined by FACS analysis for: myospheres (N=10), bone marrow cells (N=4), MDACs (N=3), and primary myoblasts (N=4). A representative profile is shown for each. Antibodies for Sca-1, CD31, and CD45 were all directly conjugated to PE. Antibodies for CD29, CD34, and CD90 were all directly conjugated to FITC. Red lines represent the negative control (unstained) and the blue lines represent cells with antibody. The y-axis indicates percentage of cells, and the x-axis the intensity of fluorescence.

