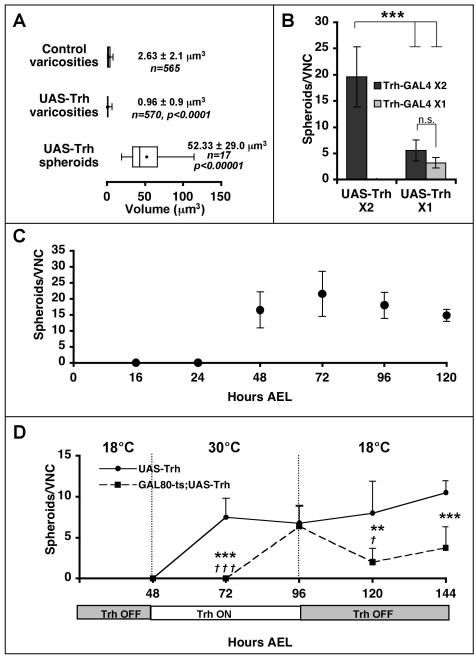
Figure 2.
Spheroid characterization reveals gene-dose dependence and temporal characteristics of reversible spheroid formation.
(A) Box-whisker plot demonstrating volume distribution of serotonergic varicosities and spheroids in control and Trh over-expressing L3F abdominal CNS. Average volumes ± s.d. are presented to the right of the boxes. P-values based on Student’s t-test comparison to control group. (B) The number of spheroids present in abdominal serotonergic neuropil is dose-dependent upon transgene expression at L3F. ***p < 0.001, Kruskal-Wallis ANOVA. (C) Spheroids are first observed in L3F abdominal neuropil 48 hours after egg lay when UAS-Trh is being maximally driven in serotonergic neurons (Trh-GAL4/Trh-GAL4;UAS-Trh/UAS-Trh). Error bars represent s.d. (D) Larvae of the sensitized genotype (Trh-GAL4/Trh-GAL4;UAS-Trh/+, solid line with circles) are compared to larvae containing a temperature sensitive Tubulin-GAL80 (Trh-GAL4/Trh-GAL4;UAS-Trh/Tub-GAL80ts, dotted line with squares) to repress Trh over-expression until shifted from 18°C to 30°C. Both groups were held at 18°C for 48 hours after AEL, then shifted to 30°C for 48 hours, then shifted back to 18°C for 48 hours. Asterisks indicate comparisons between age-matched groups from each data set. Crosses indicate comparison of GAL80-ts timepoints to the 96 hour timepoint (†p < 0.05, **p < 0.01, †††, ***p < 0.001, ANOVA). Error bars indicate s.d. B,C,D: n ≥ 8 larval CNS.

