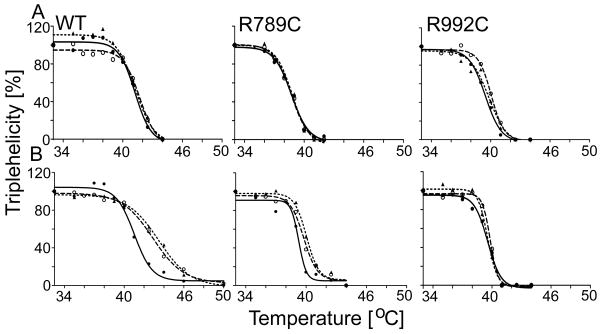
Figure 2.
A, Assays of the thermostabilities of the WT, R789C, and R992C collagen II variants isolated from HT-1080 cells cultured in the presence of 0.5 M glycerol or 0.1 M TMAO. B, Similar assays of the thermostability of the WT, R789C, and R992C collagen II variants isolated from HT-1080 cells cultured in chaperone-free media. Proteins were isolated from the media then incubated with 0.5 M glycerol or 0.1 M TMAO.
Following preincubation at increasing temperatures, collagen II samples were subjected to brief protease digestion. The digested samples were electrophoresed in 7.5% polyacrylamide gels in reducing conditions and then α1(II) chains were visualized by Western blot (Supplementary Figure S3). Subsequently, the relative pixel intensities of bands corresponding to α1(II) chains were measured by densitometry. Graphic representations of changes in the relative amount of triple-helical collagen II in response to increasing temperature are demonstrated (see Table 1). Symbols: WT, wild type collagen II; R789C and R992C, collagen II mutant harboring specific substitution; solid circles (●)and solid line, non-treated control; open circles (○) and dashed line, group treated with 0.5 M glycerol; triangles (▲) and dotted lines, a group treated with 0.1 M TMAO.

