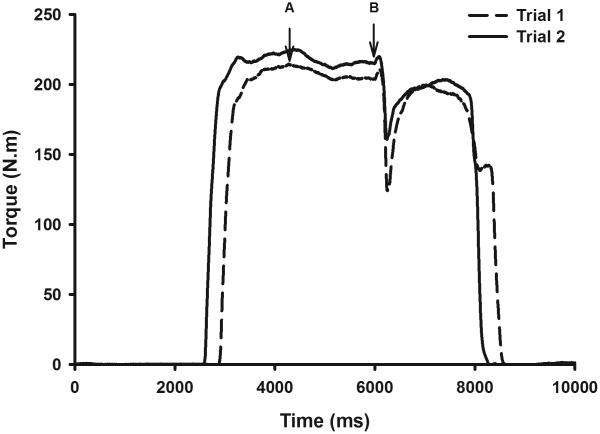
Figure 5.
Representative example that demonstrates error in estimating voluntary activation using the modified CAR approach. The torque curve from trial 1 indicates that the subject had complete activation when estimated using the modified CAR approach. The subject produced slightly higher torque at the time of stimulus delivery (Arrow B) in trial 2 when compared to the voluntary peak torque of trial 1 (Arrow A). The torque curve from trial 2, however, shows a small stimulus evoked torque during contraction, which indicates incomplete activation in the preceding trial.

