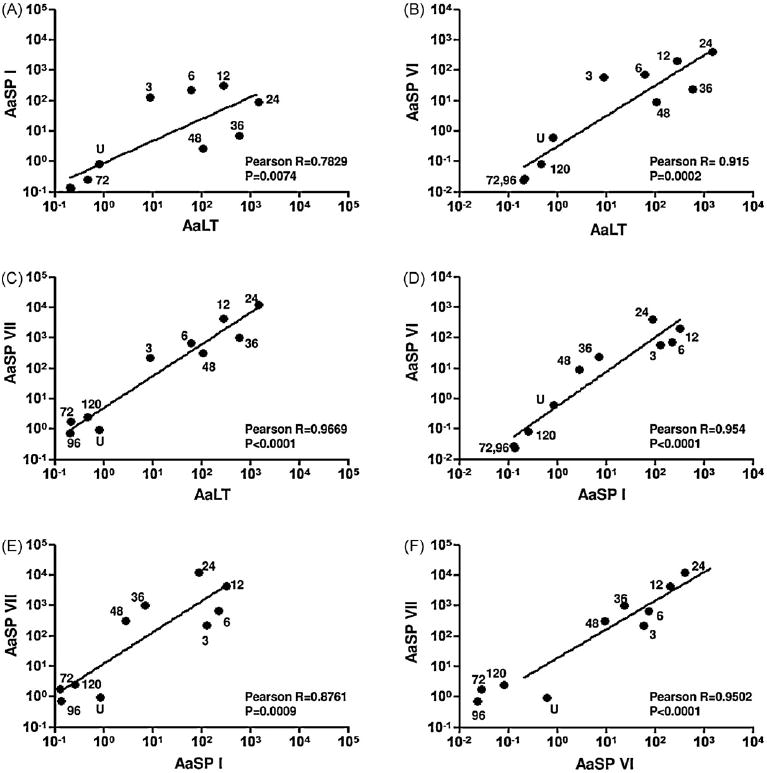
Fig. 2.

Transcriptional control of midgut serine proteases is correlated. The average transcription levels of AaLT, AaSP I, AaSP VI and AaSP VII plotted against one another. Each point is labeled as to whether it was measured in unfed (U) midguts or at 3, 6, 12, 24, 36, 48, 72, 96, and 120 h post-bloodmeal. The line on each graph represents the linear regression model obtained and Pearson’s correlation coefficients and associated probability values are listed on each graph. Numbers within figures define the timepoints post-bloodmeal. The values for timepoints 96 and 120 are not labeled within (A) because they overlap.
