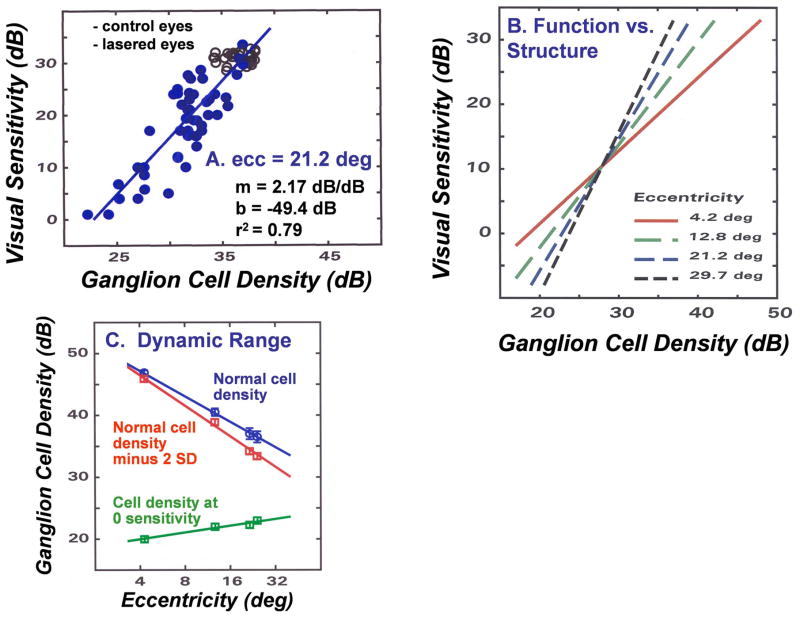
Figure 1.
A structure-function relationship between SAP visual sensitivity and histologically defined RGC density in monkeys with experimental glaucoma. (A) An example of the relationship for SAP visual sensitivity as a function of RGC density when both parameters are transformed to a logarithmic scale. Data for the control eyes are presented as open symbols and data for the lasered eyes are presented as filled symbols. The data for linear regression analysis on the data are presented in the inset (Adapted from Harwerth, et al., 2005). (B) The relationships between SAP visual sensitivity and RGC density for four retinal eccentricities, using the model described by equations 1 – 3. (C) The dynamic range of measurements by SAP based on the underlying RGC densities. The data for the normal RGC density as a function of eccentricity are based on the normal visual sensitivity at each eccentricity. The normal cell density decreased by 2 SD units represents the smallest loss of RGC density that would cause a statistically significant visual field defect. The cell density at zero sensitivity represents the RGC density at which SAP measurements fail and the RGC density cannot be assessed by clinical SAP. The distance between the lines for the cell densities minus 2 SD units and the cell densities at zero sensitivity represents the dynamic range of measurement.

