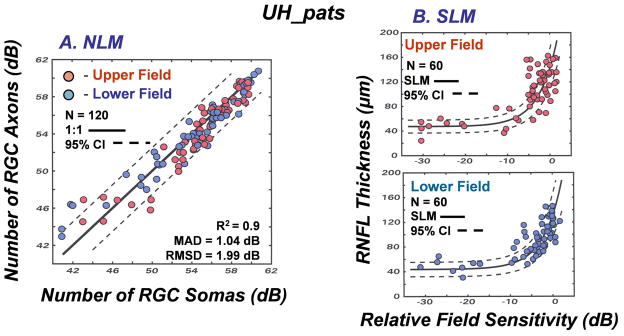
Figure 10.
Structure versus function relationships in glaucoma analyzed by nonlinear and linear models for the patients from the University of Houston (UH_pats). (A) The NLM for relating the numbers of RGC axons and RGC somas that is described by equations 6 –13. The analysis was applied separately to SAP and OCT data representing the superior and inferior hemi-fields, with resulting statistical indices shown as graph insets. (B) The SLM for relating the RNFL thickness to the relative visual sensitivity from SAP measurements. The methods described by Hood and Kardon (2007) and reproduced by equations 14 – 17 were used to analyze data for the superior and inferior fields separately. The functions superimposed on the data were constructed using parameters from Hood and Kardon (2007).

