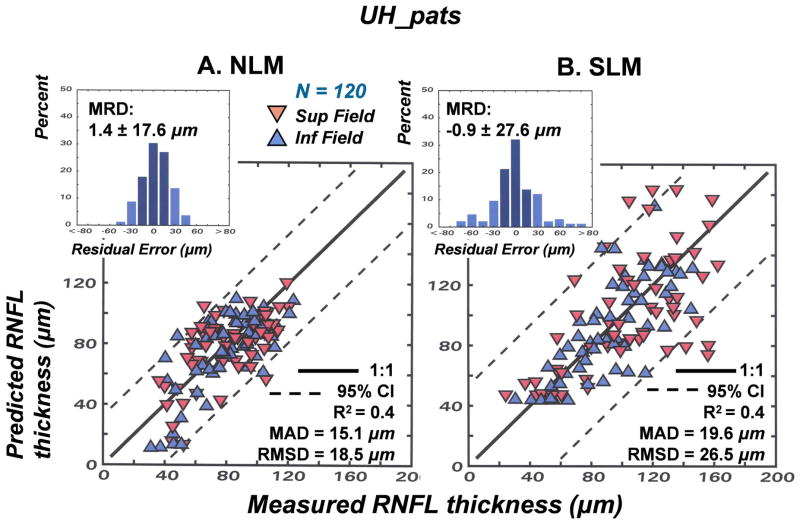
Figure 12.
Applications of the NLM and SLM to predict RNFL thickness from SAP measures of visual sensitivity for the UH_pats. (A) To derive the relationship using the NLM, the total number of RGC somas for the superior and inferior fields, via equations 6 – 9, was substituted for the number of axons in equation 13 to back-solve for the mean thickness in equation 11. (B) The relationships for the SLM were derived from the thickness vs. sensitivity relations (equations 14 – 17) that are shown in Figs. 10 and 11 for the superior and inferior fields. The evaluations of the goodness-of-fit between the modeled and measured thicknesses for the NLM and SLM are the same as described for Fig. 7.

