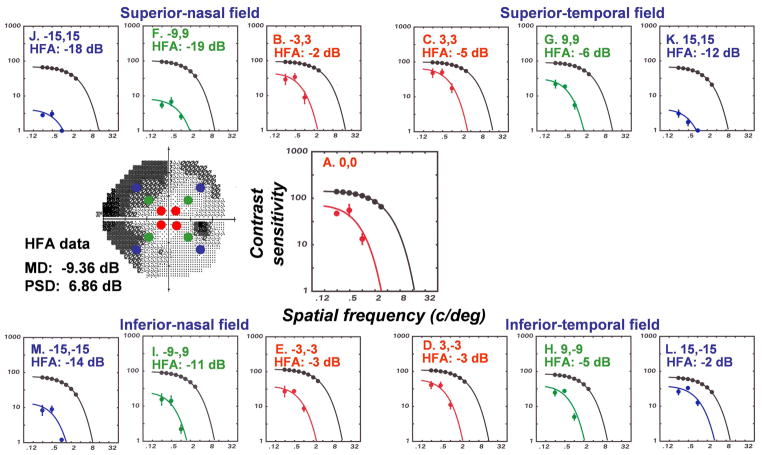
Figure 3.
SAP and contrast sensitivity perimetry for a monkey (OHT-46) with laser-induced experimental glaucoma. The gray-scale plot for SAP shows the peripheral locations for contrast sensitivity testing by the filled symbols. The contrast sensitivity functions at each location for OHT-46 are presented and, for comparison, the mean function for control eyes. The fitted functions are a two-parameter, low-pass model used to determine the height (peak contrast sensitivity) and location (cut-off spatial frequency) of the contrast sensitivity function. The total deviations from expected sensitivities for SAP of normal monkey eyes by behavioral testing with the Humphrey Field Analyzer (HFA) are inset on the graphs.

