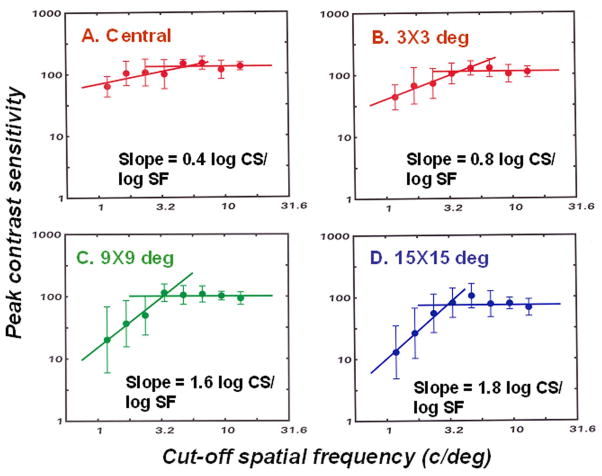
Figure 4.
The peak contrast sensitivity as a function of the cut-off spatial for monkeys with visual field defects from experimental glaucoma for central and peripheral visual field locations (A–D), shown in the graph labels. Data from six monkeys are included, with repeated measures as their visual field defects progressed. To present the main effects more clearly, the data for peak contrast sensitivities have been combined into 8 bins of spatial frequency with the mean ±SD plotted for each bin. The two-line functions were fitted to demonstrate a shift in the locations of the functions without a reduction in height, i.e., loss of contrast sensitivity. For the two-line function, with one segment was determined by linear regression over the four lowest spatial frequencies (slopes shown on the plot), and the other segment with a zero slope was placed at the mean contrast sensitivity for the three highest spatial frequencies.

