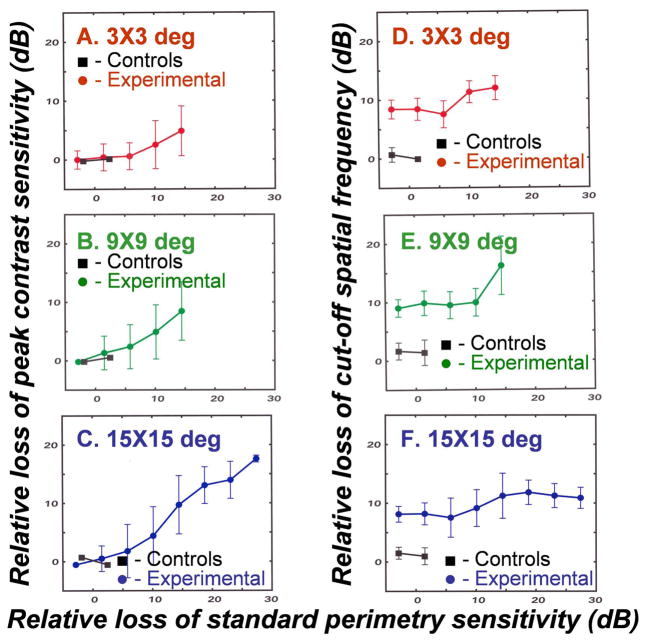
Figure 5.
A comparison of visual defects measured by contrast sensitivity with Gabor patches versus SAP with Goldmann III stimuli for 3 peripheral visual field locations (A–F) shown in the graph labels. To compare the contrast sensitivity data to SAP data, the peak contrast sensitivities and cutoff frequencies were transformed to a dB scale by 10-times their logarithmic values. The losses of peak contrast sensitivity or cut-off spatial frequency represent the measured minus the expected values at each location, based on the data for normal eyes presented in Fig. 3. The relative loss of sensitivity by clinical perimetry represent the total deviations from expected sensitivities for SAP of normal monkey eyes by behavioral testing.

