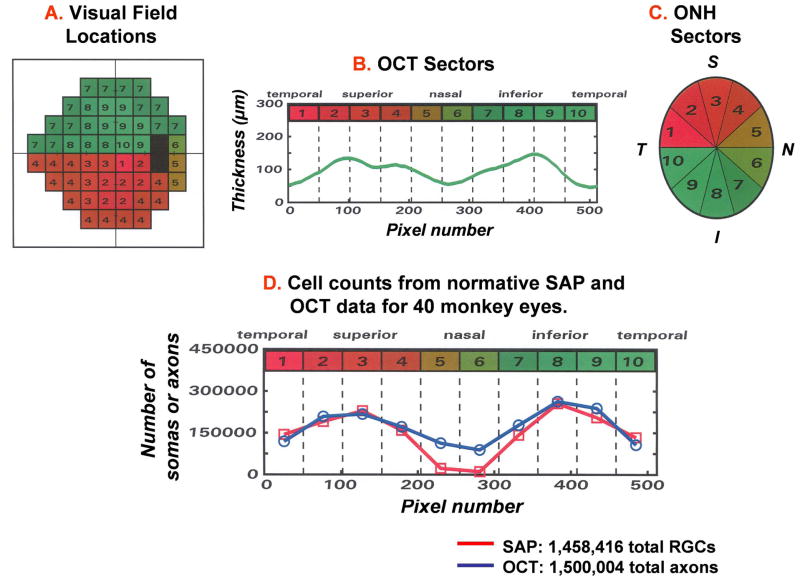
Figure 6.
A plan for mapping SAP 24-2 visual field locations and RNFL thickness measures onto the ONH, in order to correlate structural and functional measures of glaucomatous neuropathy. The SAP 24-2 visual field locations were divided into 10 equal areas (A), with each representing 51 samples of the standard (512 point) OCT scan of the RNFL (B) or a 36 deg sector of the ONH (C). The curve of RNFL thickness plotted in panel B is referred to by the acronym “TSNIT” from the relationship between the pixel number (lower scale) in the OCT scan and the RNFL location of the scan (upper labels). The RNFL thickness measures start (pixel 1) at a retinal location that is Temporal to the ONH, the measurement progresses sequentially to the Superior, Nasal, Inferior, and back to the Temporal starting location (pixel 512) for a TSNIT representation of RNFL thickness. (D) Analogous TSNIT functions for the predicted numbers of somas and axons in the RNFL based on the structure-function model (see text, functions 1– 5). The functions represent the normative data from control eyes of monkeys to compare the number of RGC somas derived from the perimetry measurements (squares) and the number of RGC axons derived from OCT measurements of RNFL thickness (circles) for each of the 10 sectors of the optic nerve head (Adapted from Harwerth, et al., 2007).

