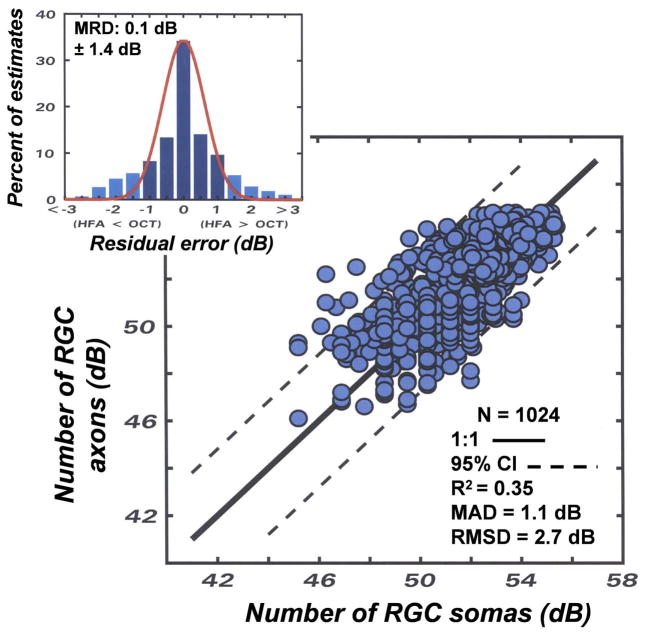
Figure 7.
An application of the structure-function model for relating SAP visual sensitivity and OCT fiber layer thickness for control and laser-treated eyes of monkeys that is described in the text (equations 1 – 5). The number of RGC axons derived from RNFL data as a function of the number of RGC somas from visual field data for corresponding sectors of SAP and OCT measurements. The correspondence between the subjective and objective measurements was evaluated by the 1:1 relationship that is illustrated by the solid line and the 95% limits of agreement that are illustrated by the dashed lines. The upper inset histogram presents the residual differences between the estimated populations of neurons, with the mean residual deviation (MRD) and the standard deviation (SD) of the distribution shown on the graph. The line superimposed on the histogram is a Gaussian distribution with parameters based on the MRD and SD of the distribution of residuals. The other statistical goodness-of-fit indices shown in the inset of the graph represent the coefficient of determination (R2), the mean absolute deviation (MAD), and root mean squared deviation (RMSD) of the axon versus soma data.

