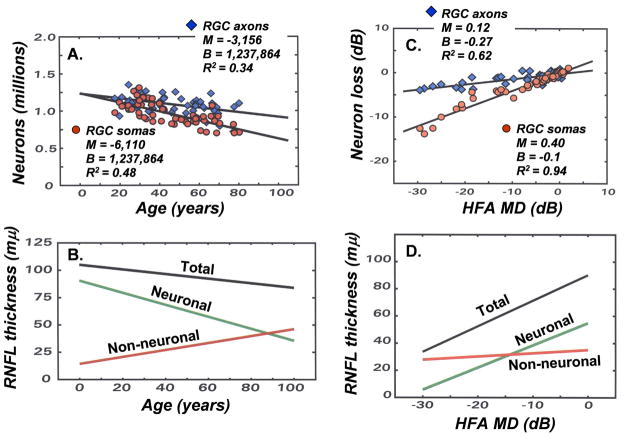
Figure 8.
Adapting the structure-function models for experimental glaucoma to human subjects by including age-dependent and stage-dependent variables for objective measures of RGC axons. (A) The decrease in the numbers of RGC somas as a function of age, using the modified relationships for the human eye (equations 6 – 9) is illustrated by the steeper linear function (parameters shown in the inset) and the decrease in RGC axons based on a constant density of axons in the RNFL is illustrated by the more shallow linear function (parameters shown in the inset). (B) To obtain agreement between the populations of RGC somas and axons, a model for the age-related thinning of the RNFL was proposed, in which the total RNFL thickness at each age represents the sum of two components of the total thickness, i.e., an age-dependent loss of neuronal tissue and a compensating increase of non-neuronal tissue, with the resulting axonal density in the RNFL and numbers of axons over a RNFL sector derived from equations 10 and 11 (figure adapted from Harwerth and Wheat, 2008). (C) The loss of neurons as a function of the perimetric index of disease severity (MD) based on the SAP visual sensitivities (steeper function, with parameters shown in the inset) or the OCT data with only compensation for the patient’s age (shallower slope, with parameters shown in the inset). (D) To obtain agreement between the populations of RGC somas and axons, a model for stage-dependent changes in RNFL thickness was proposed. The model is illustrated by data for 65 year-old patients, in which the total RNFL thickness at each stage of disease is determined by the sum of two components of the thickness, i.e., neuronal tissue thickness that decreases with the stage of disease and non-neuronal tissue that is relatively constant. The derived stage-dependent correction is described by equations 12 and 13.

