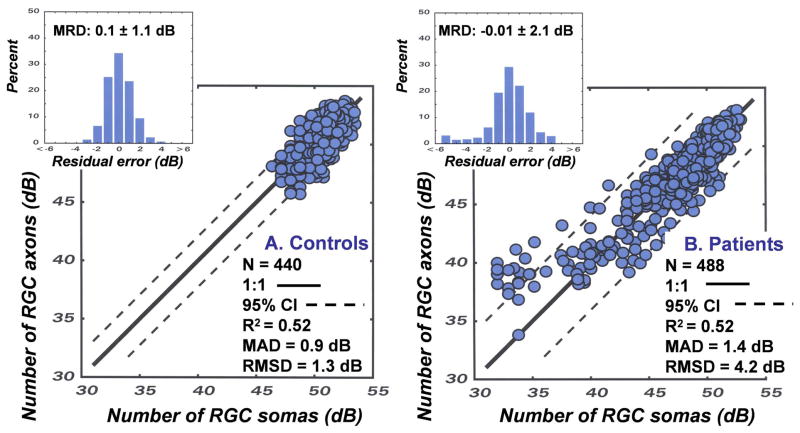
Figure 9.
Applications of the structure-function model to relate neuronal populations as measured by OCT and SAP. Data are presented for normal controls (A) and glaucoma suspects and patients with glaucoma (B). The details for the analyses and statistical indices for the goodness-of-fit are as described for Fig. 7.

