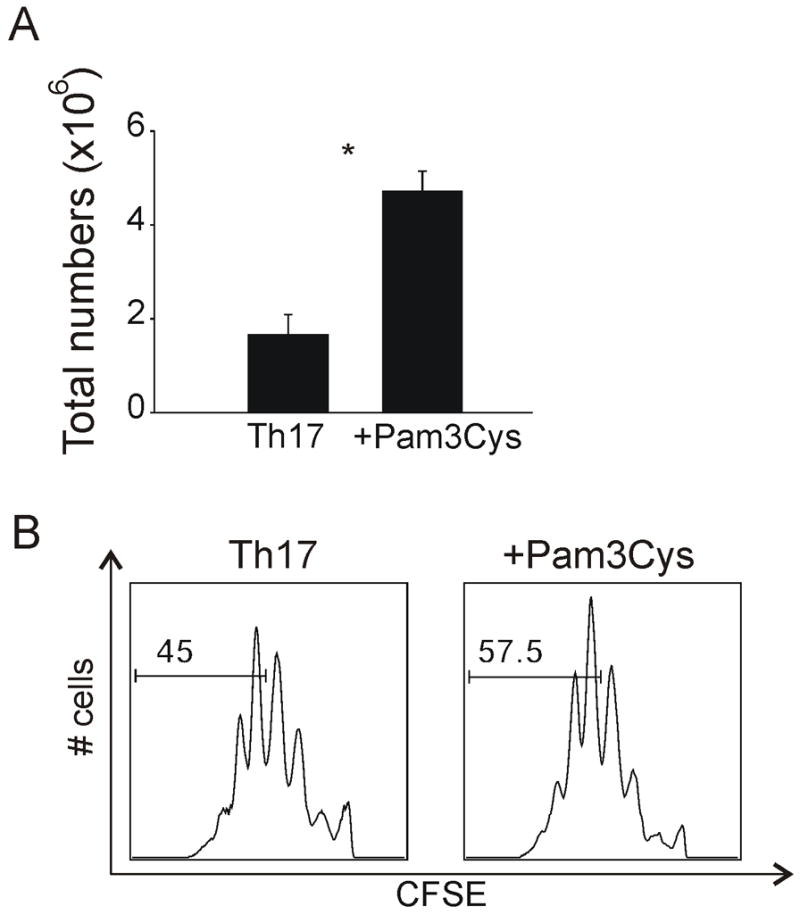
Figure 3. Proliferation of Th17 cells following TLR2 engagement.

(a) Assessment of total cell numbers following Th17 differentiation in the presence or absence of Pam3Cys. Each bar represents T cells derived from 2 individual mice. * = Students t test; p < 0.05. (b) CFSE staining of Th17 cells following 4 days of differentiation in the absence (left) or presence (right) of Pam3Cys. Numbers shown in each gate are indicative of mean fluorescent intensity. Data are a representative of four independent experiments.
