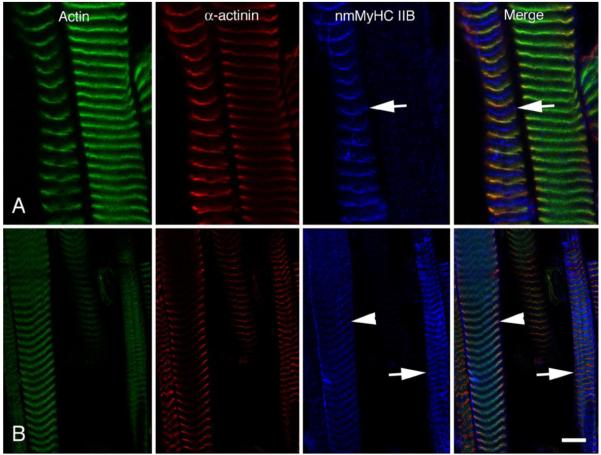
Figure 5.
Longitudinal sections of rat EOM that have been relaxed, chemically skinned and stretched. EOMs were dissected out and placed in relaxing buffer for several hours prior to flash freezing. The upper and lower panels compare the distribution of actin (green), α-actinin (red) and nmMyH IIB (pseudo blue). The gain and offset were set for optimal exposure of the nmMyH IIB in A; whereas in B the gain and offset were set to bring up the exposure of the much weaker Z-line distribution of the nmMyH IIB. The arrows indicate the A-band distribution of nmMyH IIB in both A and B). The arrowheads indicate the labeling on nmMyH IIB at the Z-line. Under these conditions the A-band distribution appears much broader in B due to saturation of the signal. Scale bar = 5 μm in upper panels and 10 μm in lower.

