
Figure 6.
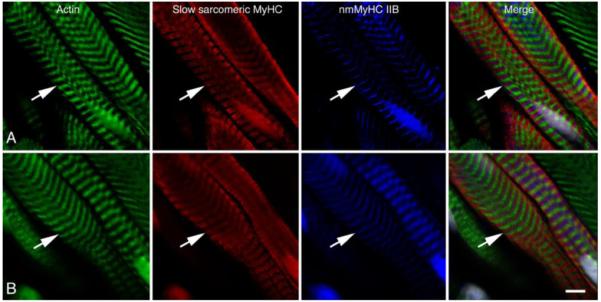
Comparison of the distribution of nmMyH IIB (pseudo blue) with the distribution of slow sarcomeric MyHC (red), actin (green) and nuclei (grey). Muscle in panel A was relaxed and flash frozen prior to sectioning, while muscle in panel B was fixed in 4% formaldehyde prior to processing. In both cases, the antibodies to nmMyH IIB label a distinct strip in the middle of the A-bands containing slow sarcomeric myosins (note arrows in both panels). The observed A-band distribution of nmMyH IIB is independent of fixation conditions. Scale bar = 5 μm.