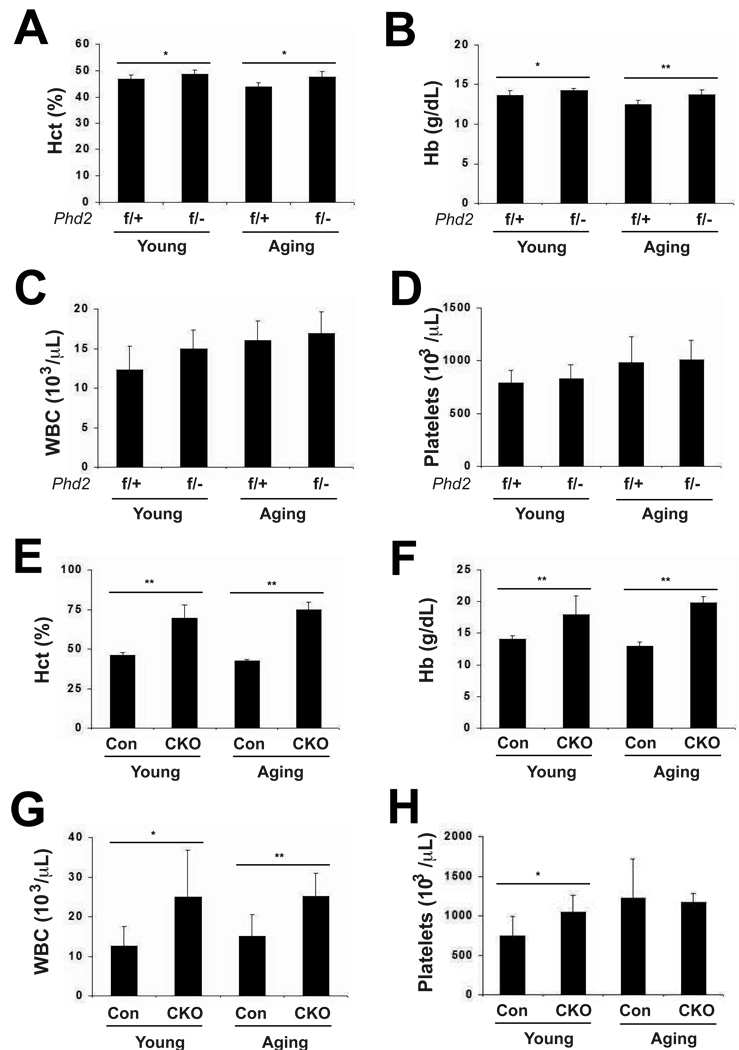
Fig. 1.
Analysis of peripheral blood in young and aging mice. (A, E) hematocrit (Hct), (B, F) hemoglobin (Hb), (C, G) white blood cell count (WBC), and (D, H) Platelets were measured. For all panels, n = 6–8. For (A–D), genotypes are as follows. f/+ = Phd2 f/+; f/− = Phd2 f/−; Rosa26-CreERT2. * indicates p < 0.05 and ** indicates p < 0.01 in comparing f/+ and f/− groups at a given age. For (E–H), genotypes are as follows. Controls (Con): Phd2 f/+; CKO: Phd2 f/−; Rosa26-CreERT2. Control and Phd2 CKO mice were administered tamoxifen for five consecutive days. Four weeks after the initial tamoxifen dose, peripheral blood was collected. * indicates p < 0.05 and ** indicates p < 0.01 in comparing control and CKO groups at a given age.

