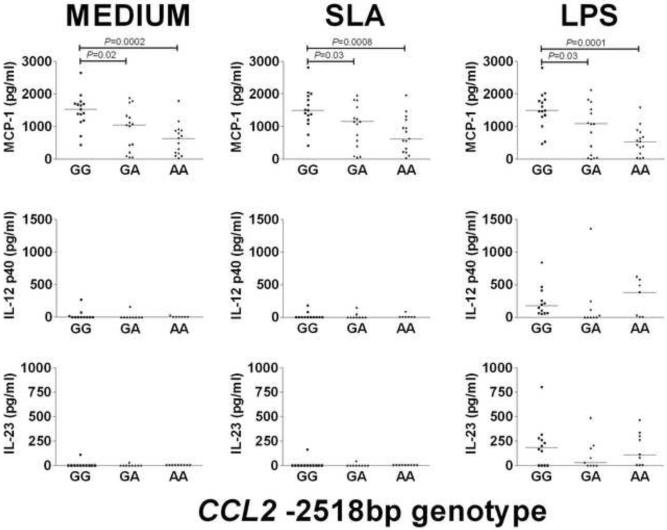
Fig. 2.
MCP-1 (n=15), IL-12p40 (n=12) and IL-23 (n=12) chemoking/cytokine production in un-stimulated (MEDIUM), SLA-stimulated, and LPS-stimulated macrophages from individuals carrying GG, GA or AA genotypes at the CCL2 −2158bp promoter region polymorphism. Optimal conditions for time (24 h) and dose (10 μg/ml) of stimulation were determined after comparing different incubation times and concentrations. Bars represent the median. Differences in numbers evaluated for IL-12p40 and IL-23 was due to either shortage of supernatant. There were no underlying differences in chemokine levels according to previous disease phenotypes (data not shown).

