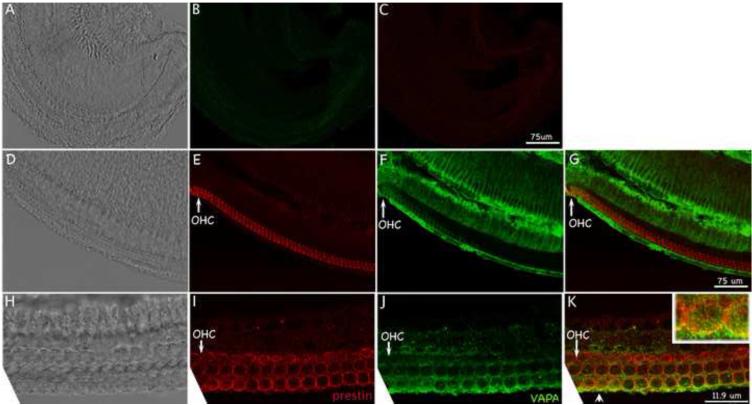
Figure 2.
VAPA and prestin co-localize in OHCs. A-C: Images of negative controls: no primary antibodies were added. D-G: The same group of cells with prestin staining (E), VAPA staining (F), and the corresponding phase-contrast image (D) of a whole-mount sample show a cross section of the organ of Corti. G shows superimposed images of E and F. H-K: The same group of OHCs with prestin staining (I), VAPA staining (J) and the corresponding phase-contrast image (H) of a whole-mount sample. In K images of I and J are superimposed. Co-localization of VAPA and prestin staining appears in yellow color as indicated by an arrowhead. The image corresponding to the location marked with the arrowhead is given at higher magnification for better examination (right corner). Red: anti-mPres staining. Green: anti-VAPA staining. A-G: low magnification images: Bar length: 75 μm. H-K: high magnification images: Bar length: 11.9 μm. Cochlear samples were collected from P5 WT-mice.

