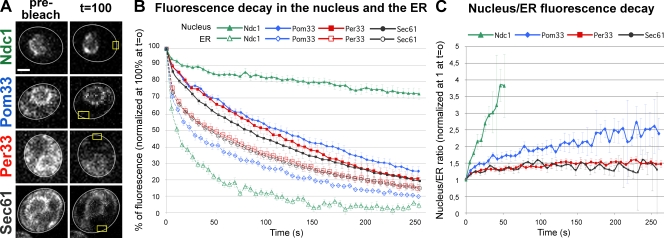
Figure 2.
Pom33 is a dynamic component of nuclear pores. (A) FLIP analysis in Ndc1-GFP–, Pom33-GFP–, Per33-GFP–, and Sec61-GFP–expressing cells. Shown are confocal microscopy images of representative cells before photobleaching and after ∼15–20 bleaching pulses (100 s). The cell shape is outlined in white and the bleached area within the cortical ER is outlined in yellow. Bar, 2 µm. (B) For each strain, the fluorescence decay in the nucleus (closed symbols) and in the ER (open symbols) was quantified as described in Materials and methods. Each curve represents the mean of a least 16 independent cells. SD is also indicated. (C) For each cell, the ratio of fluorescence in the nucleus over the ER, normalized to 1 at t = 0, was quantified at each time point. The median value and SD (error bars) are plotted over time.

