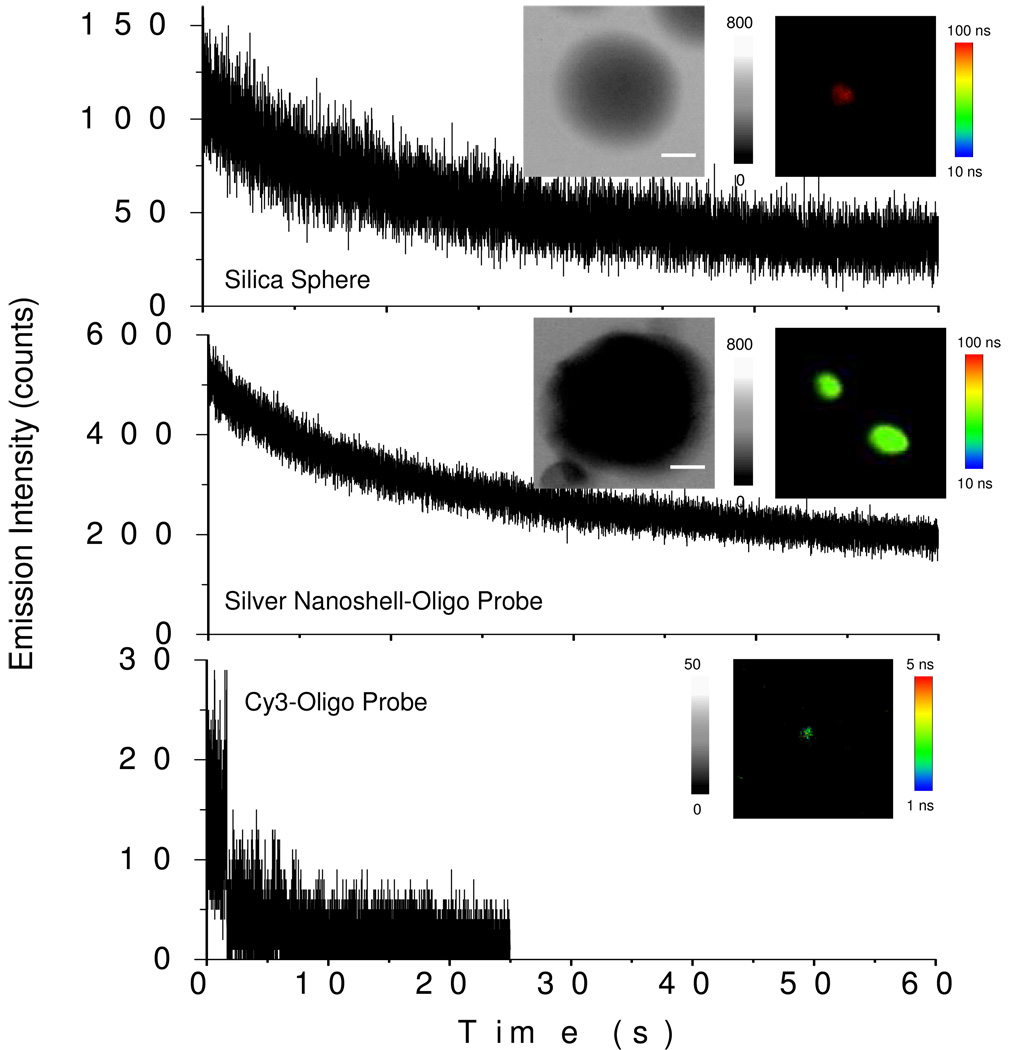
Figure 1.
The time trace profiles silica sphere, silver nanoshell, and Cy3-labeled probe oligonucleotide. The insets include the respective TEM images with the scale bars of 20 nm and typical single nanoparticle/molecule fluorescence image recorded in the emission intensity and lifetime. The scales of diagrams were 5 × 5 µm and the resolutions were 100 x 100 pixel with an integration of 0.6 ms/pixel.

