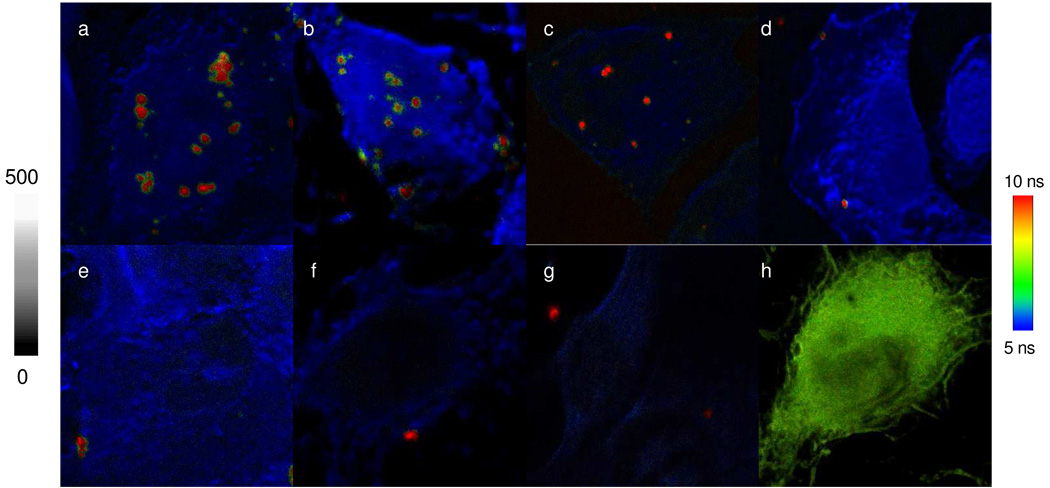
Figure 3.
Representative fluorescence images from the single cells that were incubated by the metal nanoshell with the single-stranded probe oligonucleotide conjugation (up panel) (a) H460, (b) H1944, (c) MDA-MB-231, and (d) A549 or incubated by the metal nanoshell without the probe oligonucleotide conjugation (bottom panel): (e) H460, (f) H1944, and (g) MDA-MB-231. Images (a) to (g) have the emission intensity bar from 0 to 500 and the lifetime bar from 5 to 10 ns. Image (h) represents the cell image of H1944 hybridized with Cy3-labeled oligonucleotide probe. Image (h) has the emission intensity bar from 0 to 200 and the lifetime bar from 1 to 4 ns. The scales of (a) and (e) diagrams are 20 × 20 µm and others are 50 × 50 µm. The resolutions of diagrams are an integration of 0.6 ms/pixel.

