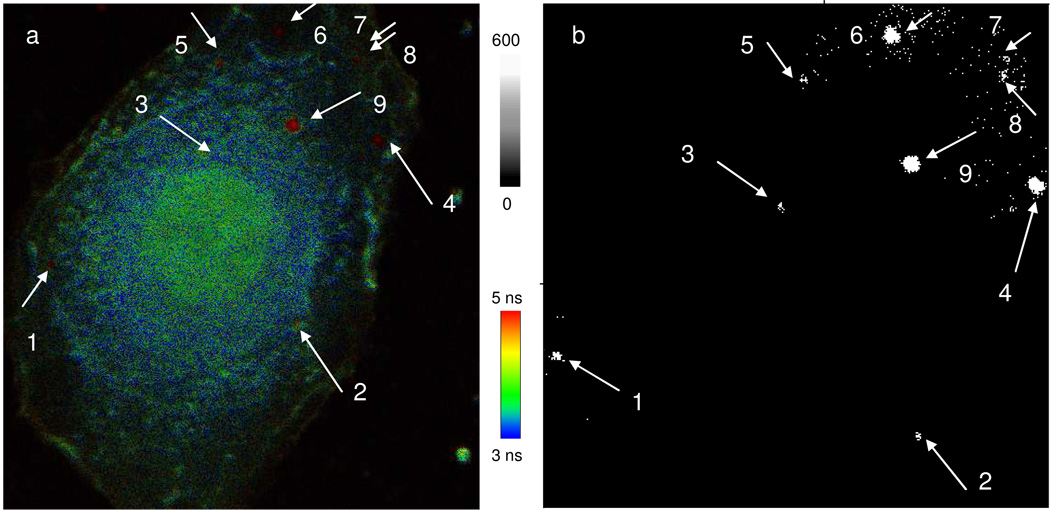
Figure 6.
A: representative fluorescence cell images of H1944. The cell lines were first incubated with the metal nanoshell probes to hybridize with the target miRNA 486 molecules in the cells. The cell lines were furthermore stained with 10 nM 1,2-dihexadecanoyl-sn-glycero-3-phosphoethanolamine triethyammonium salt and 10 nM YOYO-1 iodide for 10 min. In such a treatment, the cell membranes were fluorescently labeled with Texas Red and the cell nucleuses were fluorescently labeled with YOYO-1. The scale of diagram is 50 × 50 µm. The resolution is an integration of 0.6 ms/pixel. B: the collected emission data with the lifetime shorter than 10 ns were removed. The residual data with the lifetime longer than 10 ns were uniformly set to be one and converted into the image. The arrows and numbers on the images represent the locations of metal nanoshells in the cell.

