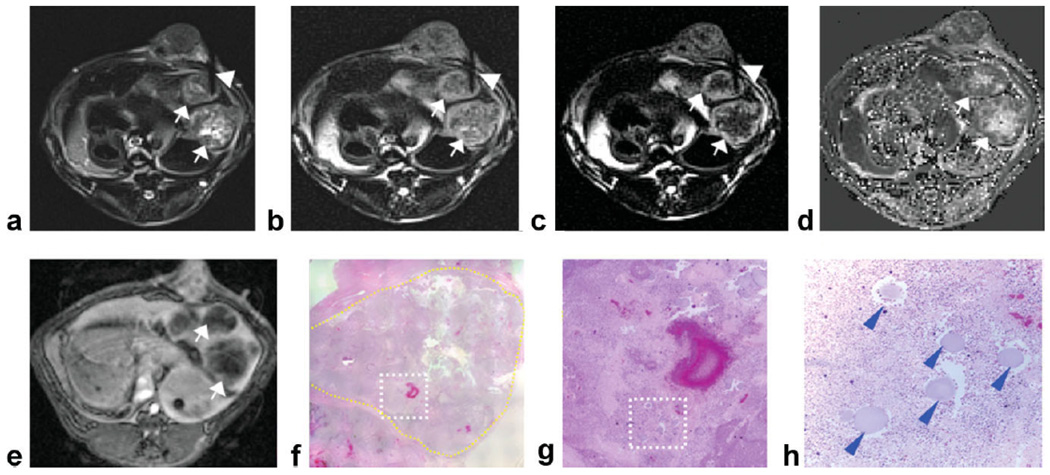
Figure 3.
Two adjacent VX2 rabbit liver tumors (arrows) with central tumor necrotic core and viable tumor periphery. DWPROPELLER images (a–c) were acquired with needle (arrowheads) positioned to target a small necrotic region located within the tumor periphery of the upper tumor (diameter = 1.7 cm). The corresponding ADC map reconstructed from baseline DW images demonstrated increased ADC measurements at the position of needle placement compared to surrounding viable tissues (d). Contrast-enhanced T1W images demonstrate perfusion of the tumor periphery (e). Overview H&E pathology image (×25 magnification) (f) of the upper tumor (yellow contour line at tumor border) shows intratumoral heterogeneous distribution of viable and necrotic tumor tissues. Magnified image (g) from inset within ×25 overview image (white dashed-box) shows the location of the injected beads (blue arrowheads) which served as our ex vivo reference for needle tip position. Tumor tissues within the region of bead deposition (×100 magnification image h from inset position within g) were classified as 100% necrotic at histopathology.

