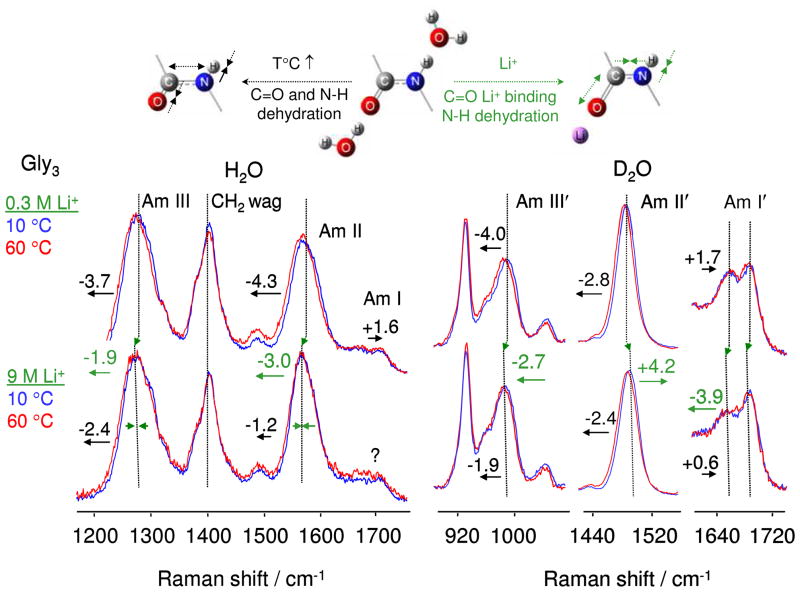
Figure 4.
UVRR spectra of gly3 in H2O (left) and D2O (right) at 0.3 M (top) and 9 M (bottom) of Li+. Blue 10°C, red 60°C. H2O and D2O contributions are numerically subtracted. The temperature induced frequency shifts between 10 °C and 60 °C are shown by black arrows. Green arrows indicate Li+ induced band shifts and band narrowing at 10 °C. The spectra are arbitrarily scaled. The molecular structures above schematically show the effects of dehydration and Li+ binding to the carbonyl oxygens on the peptide bond lengths.

