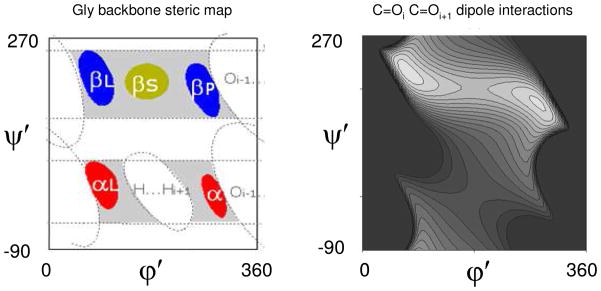
Figure 5.
Comparison of the Ramachandran plot and calculated energy map [kcal/mol] of the carbonyl-carbonyl dipole interactions for polygly (light areas correspond to the energy minima). βL and βP regions on the Ramachandran plot correspond to 31-helix (left and right-handed) energy map minima. This figure was kindly provided by Dr. Bosco Ho.

