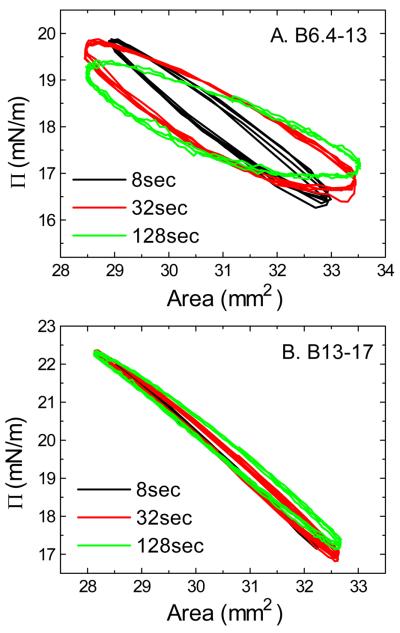
Fig. 5.
Surface pressure (Π) versus area plots of B6.4-13 (A) and B13-17 (B) at TO/W interface derived from oscillations before the buffer exchange procedure. After the equilibrium tension (γe) was reached a 16μl triolein drop was oscillated at 16−/+2μl and different periods from 8 to 128sec. (A) The concentration of B6.4-13 in the aqueous phase was 1.5×10⁻⁷M. (B) The concentration of B13-17 in the aqueous phase was 1.5×10⁻⁷M. All experiments were carried out at 25 ± 0.1°C.

