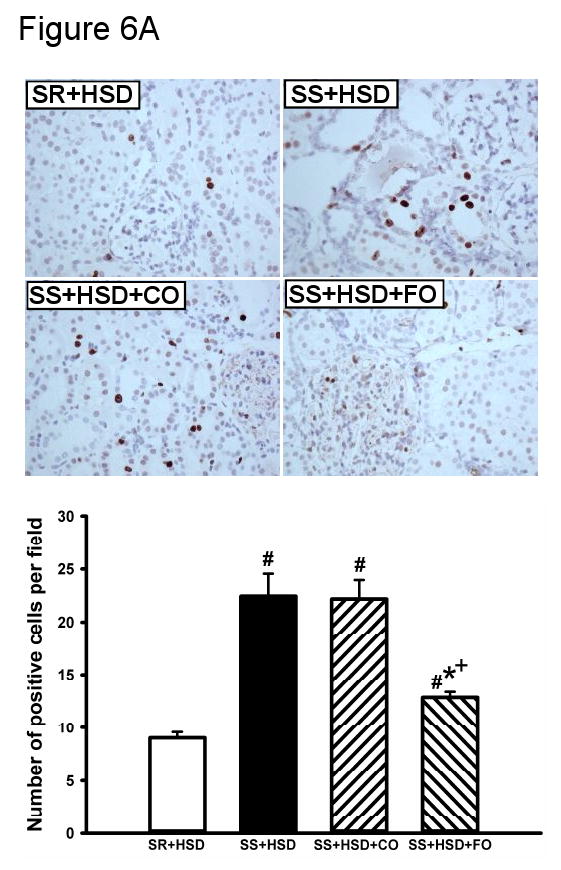
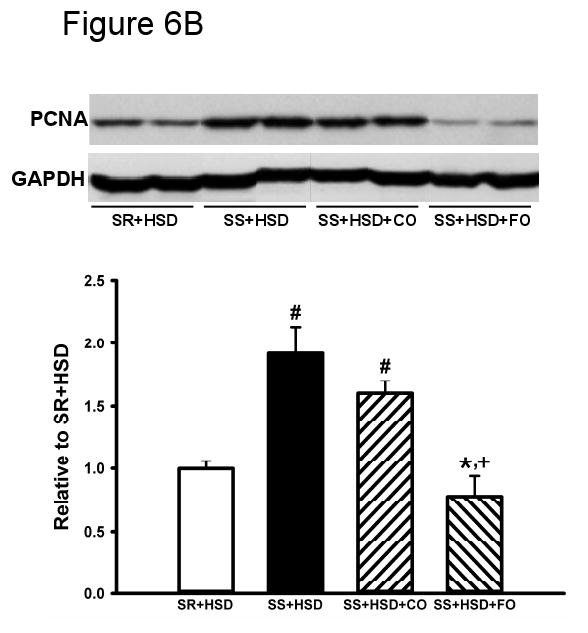
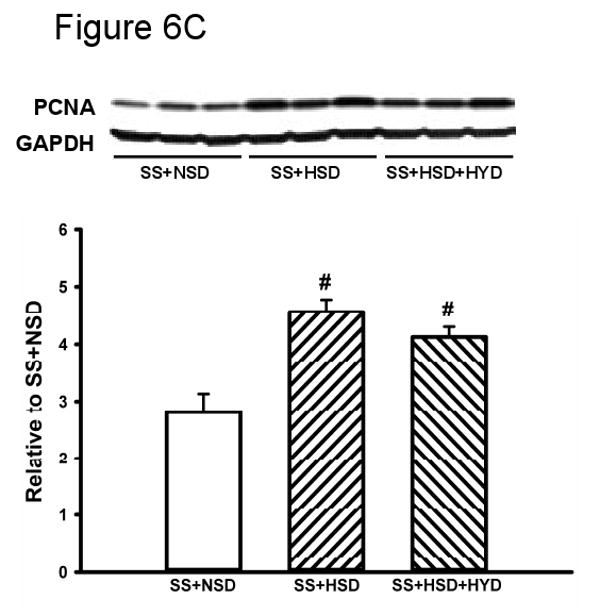
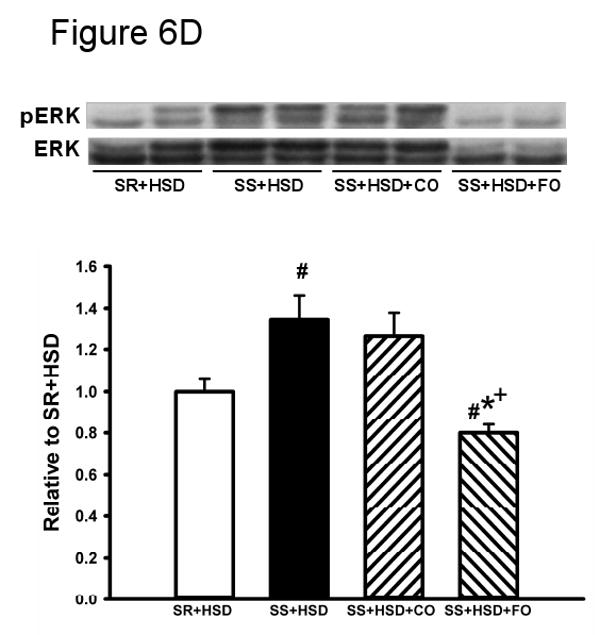
Figure 6. Fish oil has an antiproliferative effect in Dahl SS rats on a high-salt diet.


(A) Mib-1 stains of SR and SS rats after 4 weeks on high-salt diet alone (SR+HSD and SS+HSD), or supplemented with corn oil (SS+HSD+CO) or fish oil (SS+HSD+FO) as indicated. Values are mean ± SEM (n=10). (B) Western blot of PCNA expression in renal cortical homogenates from above rats, normalized to GAPDH. Values are mean ± SEM (n=10). (C) Comparison of PCNA expression in SS rats on normal-salt diet (SS+NSD, n=3), high-salt diet alone (SS+HSD, n=10) or supplemented with hydralazine (SS+HSD+HYD, n=6), normalized to GAPDH. Values are mean ± SEM. (D) Western blot of pERK expression in renal cortical homogenates from rats in (A), normalized to total ERK. Values are mean ± SEM (n=10). For (A), (B), and (D): #P<0.05 vs. SR+HSD, *P<0.05 vs. SS+HSD, +P<0.05 vs. SS+HSD+CO. For (C): #P<0.05 vs. SS+NSD. Insets = representative Mib-1 stains (A), PCNA Western blots (B, C), and pERK Western blot (D).
