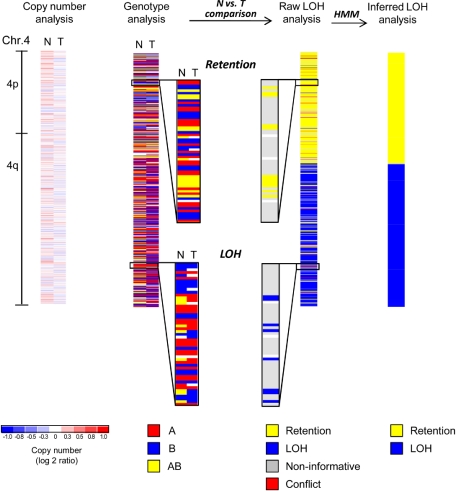
Figure 1.
SNP array analysis of chromosome 4 of an MDS patient with a normal karyotype. Copy number analysis of chromosome 4 reveals no deletion or amplification in the tumor sample (T, mononuclear bone marrow). The paired normal DNA sample (N, buccal swab) is also shown. White areas indicate no copy number change (log2 ratio = zero), whereas shades of blue and red designate losses and gains, respectively (see scale at bottom). Minor fluctuations of blue and red are the result of data noise. Genotype analysis detects 3 distinct genotypes (A, red; B, blue; AB, yellow; white, no call). Comparison of normal (N) versus tumor (T) samples reveals that heterozygous calls (AB, yellow) are converted into homozygous calls (A or B, red or blue) in a distal segment of the q-arm indicating loss of heterozygosity (LOH), whereas the single nucleotide polymorphism (SNP) genotypes are retained in the proximal q-arm and the p-arm of the chromosome (retention). Raw LOH analysis is performed by computational comparison of normal-versus-tumor samples, resulting in a single column. Homozygous SNPs are noninformative in such a comparison (gray). Retention is depicted in yellow and LOH in blue. In rare instances, genotype detection errors lead to an apparent heterozygous SNP genotype in the tumor sample paired with a homozygous SNP genotype in the normal sample, and these cases are detected as conflicts (red). Note that yellow and blue have a different meaning in LOH analysis as opposed to genotype analysis (see color codes beneath each type of analysis). Hidden Markov models (HMM) are used to convert the single SNP-based raw LOH data along the chromosome into segments. Finally, inferred LOH analysis represents the last step of the genotype comparison between normal and tumor samples, revealing a copy-neutral LOH (CNLOH) of 4q in this myelodysplastic syndromes (MDS) patient.

