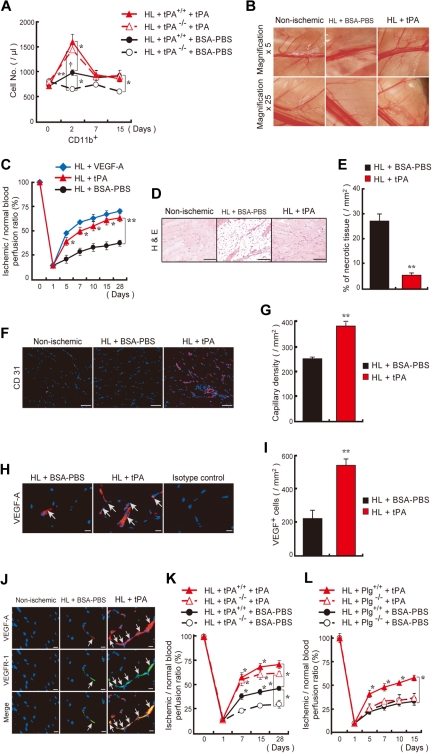
Figure 2.
tPA administration accelerates revascularization in a HL ischemia model. (A) tPA or vehicle was injected intraperitoneally daily from day 0 to day 2 into tPA+/+ and tPA−/− mice after HL ischemia induction. The frequency of circulating CD45+CD11b+ cells was measured (n = 3 per group). The single dagger (†) symbol denotes a significant difference (P < .05) between day 0 and day 2 in HL tPA+/+ mice. (B) C57BL/6 mice were treated with tPA or vehicle. Macroscopic pictures of the lower limb region were taken on day 15 after HL induction. Images were acquired with 0.5× and 2.5×/0.1 numeric aperture (NA) lenses (corresponding to 5× and 25× magnification), an Olympus SZX7 camera, and Adobe Photoshop CS3. (C) The ischemic/normal blood flow ratio, determined by analysis of the whole cross-section of the limb by laser Doppler perfusion imaging analysis, is shown as a function of time. (D-G) Evaluation of necrotic areas (D-E, after 15 days; bar = 200 μm) and capillary density in sections (F-G, after 28 days; bar = 50 μm) of HL-induced mice treated with or without tPA (n = 6 per group). Panels D and F were acquired with a 20×/0.50 NA and a Carl Zeiss KS400 camera, and analyzed using Axio Vision (Carl Zeiss). (H-I) Quantification of VEGF-A+ cells (arrows) in ischemic tissues (n = 6 per group, after 15 days; bar = 20 μm). Images were acquired with a 40×/0.75 NA and a Carl Zeiss KS400 camera, and analyzed using Axio Vision (Carl Zeiss). (J) Immunohistochemical staining of VEGFR-1 and VEGF-A of ischemic muscle tissues derived from vehicle- or tPA-treated HL ischemic mice and nonischemic mice. Arrows indicate VEGFR-1+VEGF-A+ cells (bar = 20 μm). Images were acquired with a 40×/0.75 NA and a Carl Zeiss KS400 camera, and analyzed using Axio Vision (Carl Zeiss). (K-L) tPA or vehicle was injected intraperitoneally daily into tPA (K) or Plg (L) wild-type and deficient mice after induction of HL ischemia. Functional perfusion measurements of the collateral region were performed (n = 3 per group). A significant difference between tPA+/+ and tPA−/− mice treated with BSA-PBS is shown. If not otherwise mentioned, asterisks denote significant differences between BSA-PBS– and tPA-treated groups. *P < .05; **P < .001; values represent the mean ± SEM.

