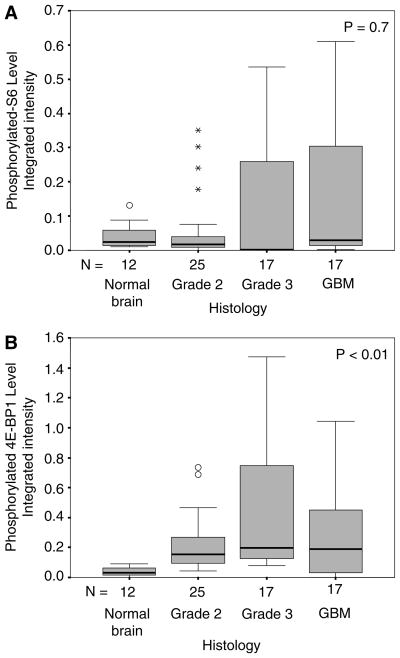
Fig. 1.
Boxplots depicting, (a) phosphorylated-S6 levels and (b) phosphorylated-4E-BP1 levels, in non-tumor brain, grade II gliomas, grade III gliomas, and glioblastoma (GBM). Black horizontal line represents the median value for each group; gray box represents the middle 50% of the values, lying between 25 and 75%; horizontal gray lines represent the minimum and maximum values observed in each group; (o) represents outlier greater than two standard deviations from the median; (*) represents extreme value greater than three standard deviations from the median. Statistical analysis was performed using the Spearman’s Correlation Coefficient

