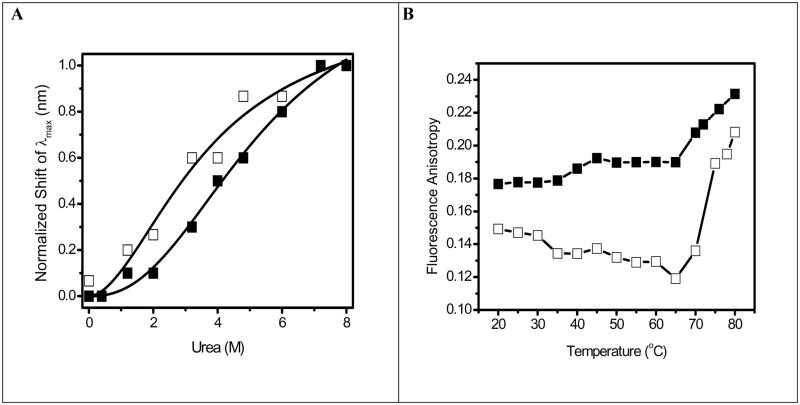
Fig. 3.
Fig. 3A. Shift in fluorescence emission maximum for OPH in solution (□)and OPH in HOOC-FMS (PLD = 53) (■) during chemical unfolding using urea. The samples contained 10 μg/mL of OPH in 20 mM HEPES (pH 7.5). The specific activity of OPH in solution was 1690 units/mg, while the specific activity of the resulted OPH-FMS was 2569 units/mg. Line represents a nonlinear least squares fit to changes in fluorescence wavelength λmax) to the Hill equation , where n is the Hill coefficient (~2) and K1/2 is the half-saturation urea concentration. The obtained K1/2 is 3.7 M for OPH in solution, 5.4 M for OPH in HOOC-FMS.
Fig. 3B. Temperature-dependent changes in fluorescence anisotropy of Trp for OPH in solution (□) and OPH in HOOC-FMS (PLD = 62 μg/mg) (■). The samples contained 50 μg/mL of OPH in 10 mM potassium phosphate (pH 7.5) at 25°C. The specific activity of OPH in solution was 915 units/mg, while the specific activity of the resulted OPH-FMS was 1598 units/mg. Steady-state fluorescence anisotropy was measured at 334 nm with excitation at 295 nm at 25°C.

