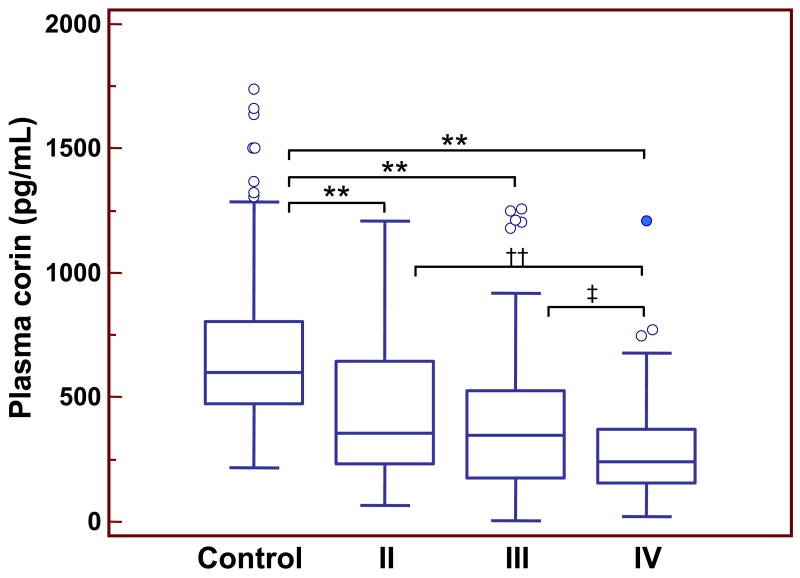
Figure 2.
Plasma corin levels in controls and HF patients of NYHA classes II-IV. Results were from 198 normal controls, 69 HF patients of class II, 132 HF patients of class III, and 90 HF patients of class IV. Each box represents the median and IQR values. The outliers that are >1.5 and >3 times of IQR are indicated by open and filled circles, respectively. The vertical I bars indicate the non-outlier minimum and maximum. **p<0.001 vs. control; ††p<0.001 vs. IV; ‡p<0.05 vs. IV.

