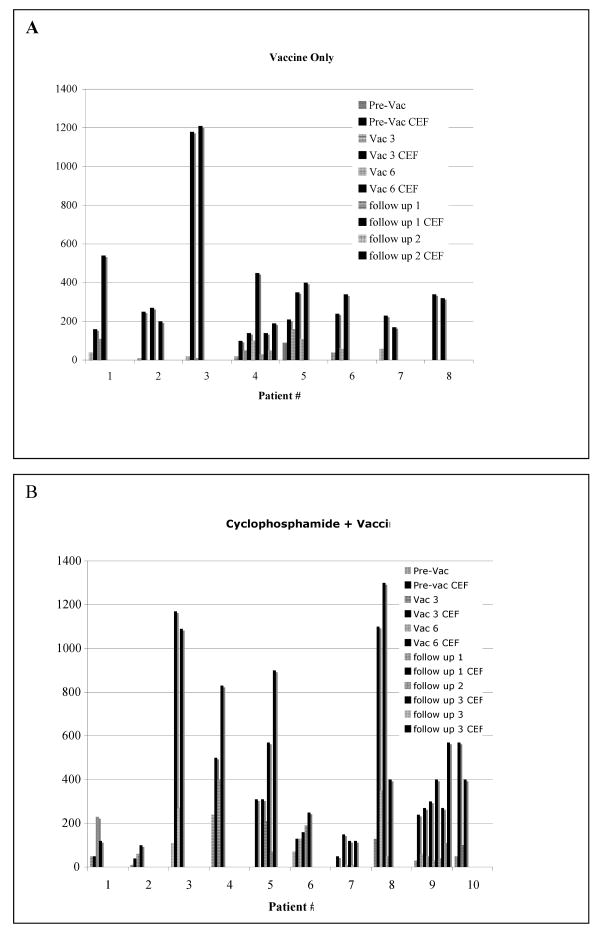
Figure 1. Comparison of the magnitude of CD8+ T cells specific for mesothelin versus the CEF pool of peptides.
An Elispot analysis was performed to determine the number of interferon-gamma secreting T cells specific for mesothelin as described in Table 4. All patient lymphocytes were also assessed for recognition of an HIV negative control peptide and a positive antigen control pool of peptides (CEF pool). Background spots ranged from 0-10 spots/per well as described in Table 4. Graphed is the mesothelin specific T cell response data presented in Table 4 and the corresponding CEF pool specific CD8+ T cell responses. A. Immunotherapy Only Cohort. B. Cyclophosphamide + Immunotherapy Cohort. Striped bars=mesothelin data. Black bars=CEF pool data.

