
Figure 1.
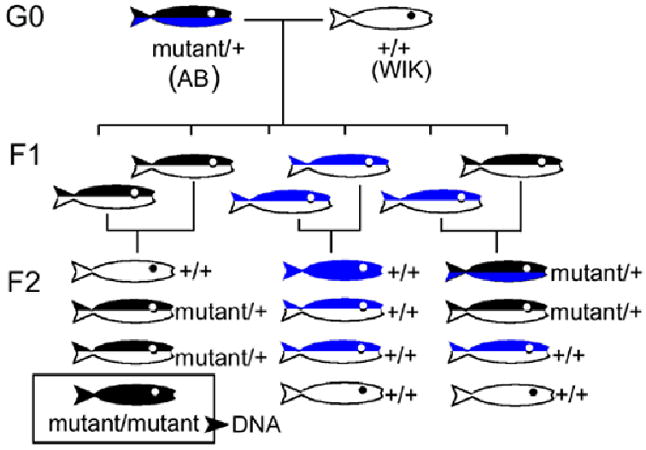
Genetic crosses used to generate homozygous mutant fish. Diagram showing genetic crosses used to generate homozygous mutant fish for linkage analysis. In the F1 and F2 generations, the relative Mendelian proportions of each class of progeny is shown. Homozygotes are solid color, heterozygotes are two colors. The mutant chromosome is shown in black. The wild type chromosomes (+) are shown in blue (AB background) or white (WIK background).