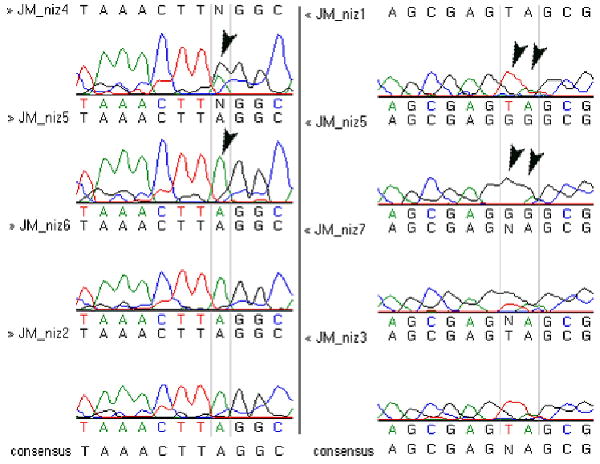
Figure 6.

Chromatographs showing representative results of linkage analysis of the crx gene in homozygous niem743 mutants from mapping panel. Variable regions of crx exon 1 were PCR amplified from a mapping panel generated from individual homozygous niem743 mutants (JM_niz1 thru JM_niz7) and sequenced. Alignment of the sequence data using VectorNTI/Contig Express software (Invitrogen) identified regions of sequence variability, indicated on the chromatographs by vertical gray lines and arrowheads. In the left panel, JM_niz4 has a double peak (heterozygous for A and G) compared to JM_niz5 has a single peak (homozygous for A). In the right panel, arrowheads indicate a variable di-nucleotide sequence: TA in JM_niz1 and GG in JM_niz 5.
