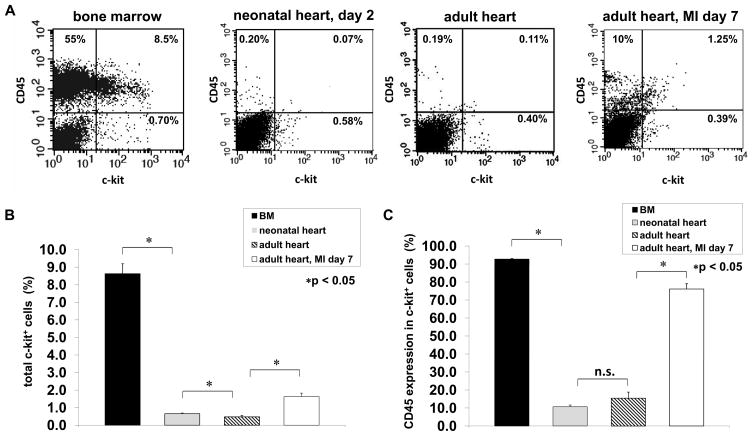
Figure 1. Characterization c-kit+ cells.
(A) Representative FACS dot plots showing the distribution of CD45+/c-kit−, CD45−/c-kit+ and CD45+/c-kit+ cells from bone marrow, neonatal heart, and normal and infarcted adult heart. (B) Quantitative analysis of c-kit+ cells from bone marrow, neonatal heart and normal and infarcted adult heart. (C) Quantitative analysis of the percentage of c-kit+ cells co-expressing the hematopoietic marker CD45. Data represent mean ± SEM (n=6). *p < 0.05; n.s.: not significant.

