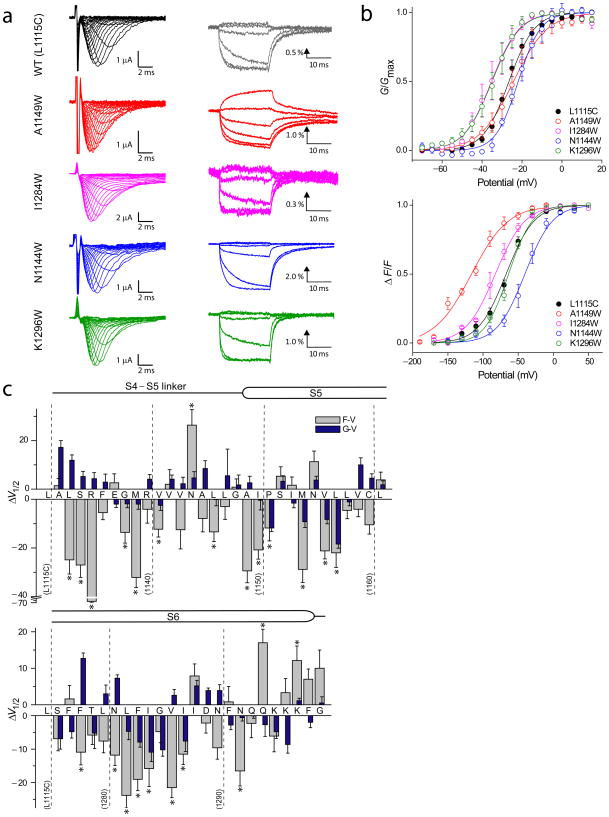
Figure 2. Voltage-dependent conductance and fluorescence responses in the mutant sodium channels.
(a) Families of ionic current and fluorescence traces corresponding to the WT (L1115C) and four representative tryptophan mutants. Ionic currents were elicited by pulsing to various test potentials (−100 to 65 mV at 5mV intervals) for 20 ms following a brief (50 ms) prepulse to −120 mV. Fluorescence traces were recorded by pulsing to various test potentials (−170 to 50 mV at 20 mV intervals) for 20 ms following a 50 ms prepulse to −120 mV. Each of fluorescence trace was obtained by averaging 10 trials with a 1 s inter pulse interval. Fluorescence traces are shown at 40 mV interval for clarity.
(b) Normalized G–V and F–V curves corresponding to the wild type (L1115C) and the tryptophan mutants shown in (a). The conductance was normalized to the peak conductance (Gmax) whereas the fluorescence response was normalized to maximum steady state fluorescence (F) values for each oocyte. The data points represent the mean ± standard error (S.E.) of at least three independent measurements and the smooth curves represent the best fits of the averaged data to a single Boltzmann function.
(c) The difference in the half-maximal responses (ΔV1/2) between the WT and mutants. The ΔV1/2 of both fluorescence (grey) and conductance (blue) for each of the mutants are shown. Error bars represent propagation of errors. Statistical analysis of ΔV1/2 of the F–V relationships was performed with a one-way ANOVA with Dunnett’s post-tests, *p<0.05.

