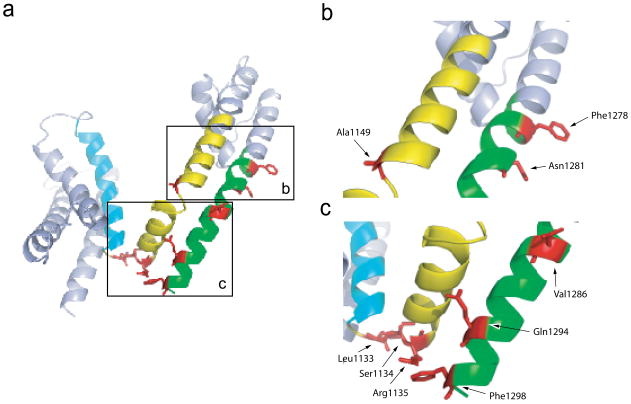
Figure 5. Mapping the prominent class II mutants on to the structural model of sodium channel domain III.
(a) The sites of class II mutations are highlighted in red. The voltage-sensing S4 segment is in cyan. The other mutated positions in the S4–S5 linker and S5 are shown in yellow whereas those in the S6 segment are shown in green.
(b) Enlarged view of the lower part of S5 and the middle part of S6 near the gating hinge.
(c) Enlarged view of the S4–S5 linker and the bottom part of the S6.

