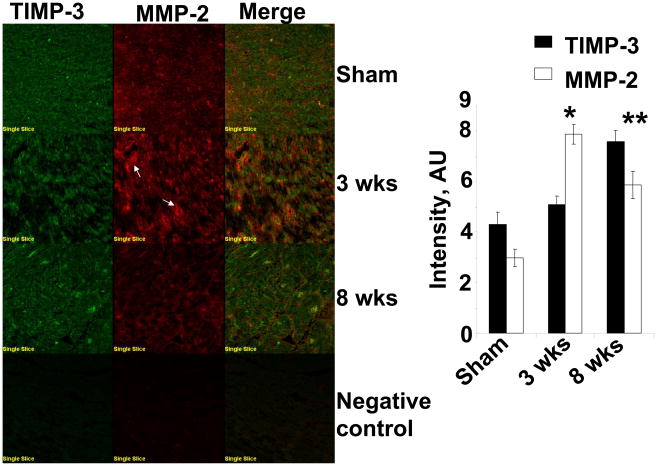
Figure 7.
Left ventricle immunohistochemical staining and co-localization of TIMP-3 and MMP-2: Cryocut frozen sections of (8–10 μm) were stained and secondarily conjugated with FITC for TIMP-3 and texas red for MMP-2 (white arrows indicate capillaries). The bar diagrams depicted the intensity quantification of TIMP-3 and MMP-2 by Fluoview software, in sham (8wks), 3 wks and 8 wks aortic banding. Data presented mean ± SE; *p<0.01 vs sham; **p<0.05 vs 3 wks; n=5 animals per group.

