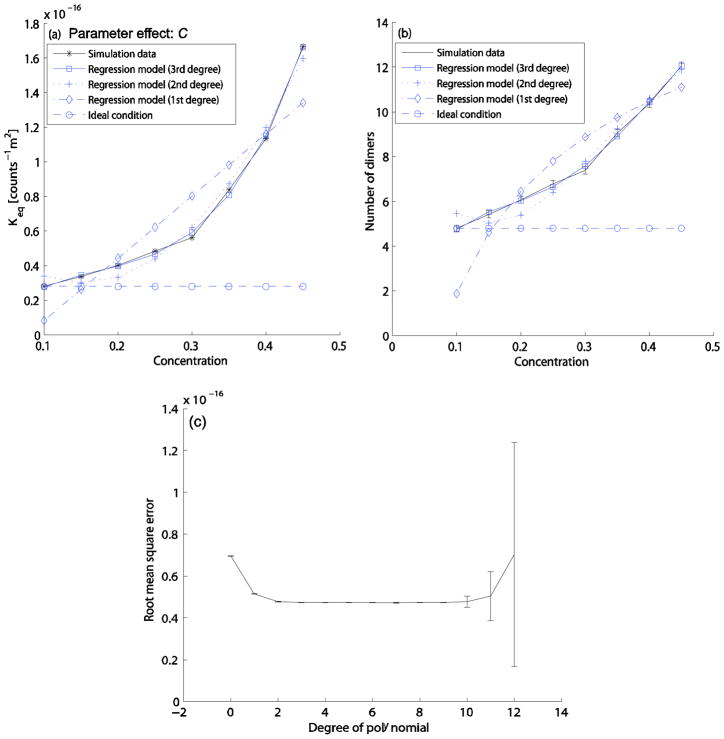
FIG. 3.
Effect of parameter C on the homodimerization reaction. For the simulation data, all particles are reactants at C=0.1, and then inert particles are added as the total concentration increases. C values are tested from 0.1 to 0.45 as the increment of 0.05. The other parameter values for this test case are set to the default parameter values (B=0.7, M=1ns, D=13.9×10⁻¹¹m2s−1, α=2, β=1, and dth=0.5nm). (a) Keq curves: simulation data (solid line with star marks), 3rd degree fitted curve (solid line with square marks), 2nd degree fitted curve (dotted line with plus marks), 1st degree fitted curve (dash-dot line with diamond marks), idealized values assuming no crowding effect (dashed line with circle marks). (b) Quasi-equilibrium dimer count curves: simulation data (solid line with errorbars), predicted data curve from the 3rd degree fitted curve in (a) (solid line with square marks), predicted data curve from the 2nd degree fitted curve in (a) (dotted line with plus marks), predicted data curve from the 1st degree fitted curve in (a) (dash-dot line with diamond marks), idealized values assuming no crowding effect (dashed line with circle marks). (c) Root mean square errors of fit for the C regression model as a function of model degree. Each fit is based on 10-fold cross validation using 100 iterations, with all data points randomly shuffled for every iteration.

