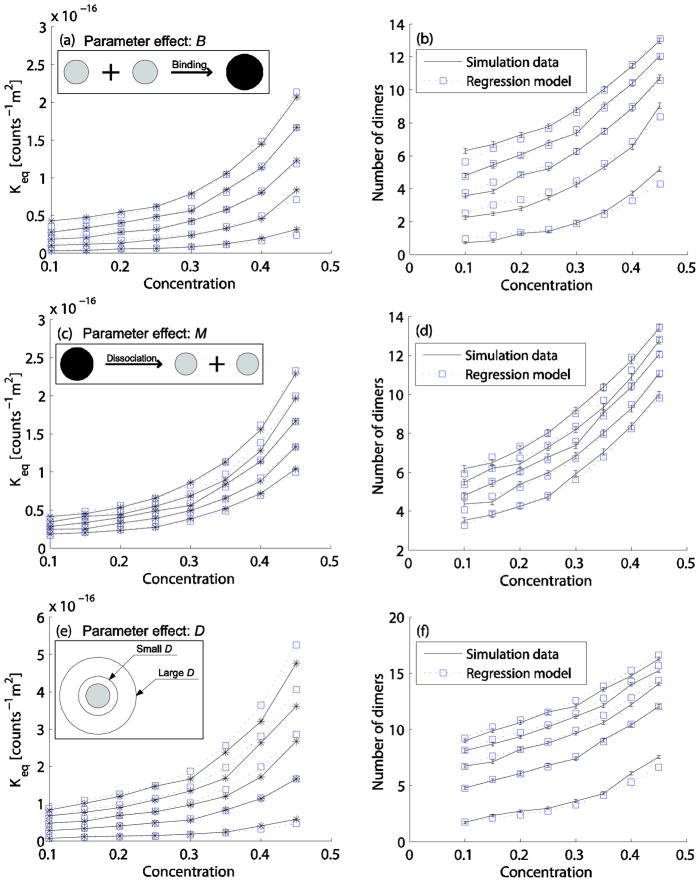
FIG. 4.
Effect of parameters B, M, and D on the homodimerization reaction. The first column (a, c, e) shows the Keq curves of the average simulation data (solid line with star marks) and fitted data (dotted line with square marks) from Eq. (6–8, respectively). The second column (b, d, f) shows the dimer counts for simulation data (errorbar) and predicted data (a dotted line with square marks) from Eq. (6–8, respectively) and Eq. (4). (a,b) B values from 0.1 (bottom), 0.3, 0.5, 0.7, 0.9 (top), and C from 0.1 (all reactants) to C=0.45 (0.1 for reactants and 0.35 for inert particles) with other parameter values set to the default values (M=1ns, D=13.9×10⁻¹¹m2s−1, α=2, β=1, and dth=0.5nm). (c,d) M values from 0.6 (bottom), 0.8, 1.0, 1.2, 1.4 ns (top) with other conditions the same as in (a,b). (e,f) D values from 3.9 (bottom), 13.9, 23.9, 33.9, 43.9×10⁻¹¹m2s−1 (top) with other conditions the same as for (a,b).

