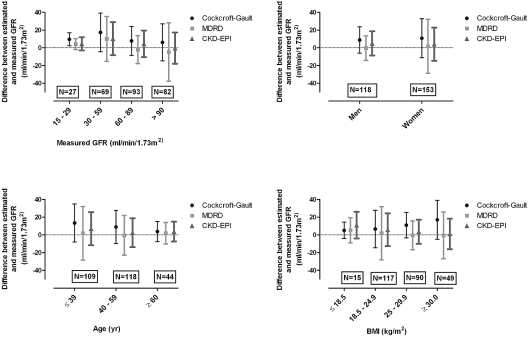
Figure 2.
Comparison of the bias and precisions over subgroups. Mean bias and precision between estimated and measured GFR for to various strata of GFR, gender, age, and BMI. The mean bias was calculated as the mean of the differences between the estimated and measured GFR per subgroup, whereas the precision was the SD of this difference.

