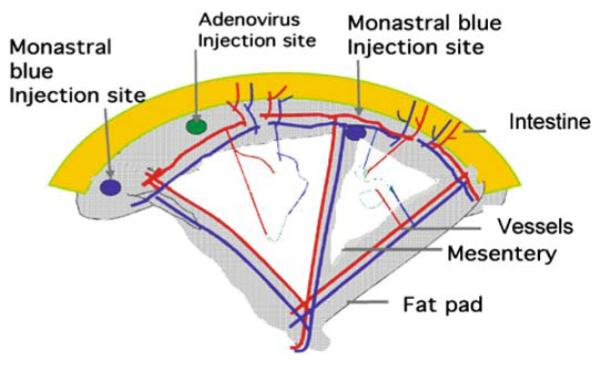
Fig. 15.1.
A schematic representation of rat mesenteric angiogenesis assay demonstrating the intestine (grey), the fat pad (shingle), the transparent mesentery (white). Within the mesenteric panel are the microvessels, showing approximately equal distributions of pre-, post-, and true capillary order vessels. The adenovirus is injected into the fat pad (marked checked circle), and the panel is located by placing a tattoo on either side of the injected panel.

